Leaves as Thermometers

Leaves as Thermometers
Do you ever wonder what the climate was like in Los Angeles during the Ice Age when mammoths, saber toothed cats, and giant ground sloths lived in our neighborhoods? With this activity you will learn how paleontologists measure ancient temperature from leaves. Try this activity at home and share your results with our scientists!
There are two parts to this activity:
1. First, you will collect leaves in your neighborhood to determine the mean annual temperature (MAT – the average daily temperature for a whole year) for Los Angeles today.
2. Second, you will use the same method to reconstruct temperature from pictures of leaves from species recovered as fossils from La Brea Tar Pits.
Part 1: What is the Mean Annual Temperature of your neighborhood?
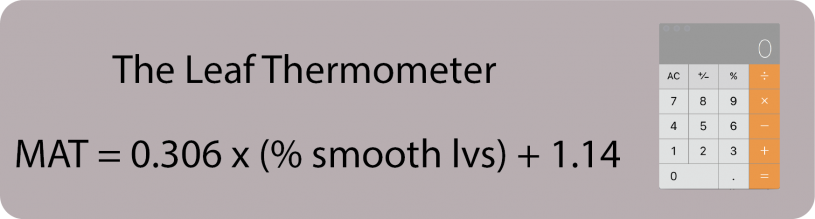
To practice using the Leaf Thermometer and to measure what the mean annual temperature of Los Angeles is today, follow these steps:
1. Go outside and collect one leaf from 15-20 different species of broad-leaved trees (like a maple, oak, avocado, etc.).
2. Sort the leaves according to leaf type: 1) Smooth Edges and 2) Toothy Edges.
3. Count the number of Smooth Edge leaves and Toothy Edge leaves.
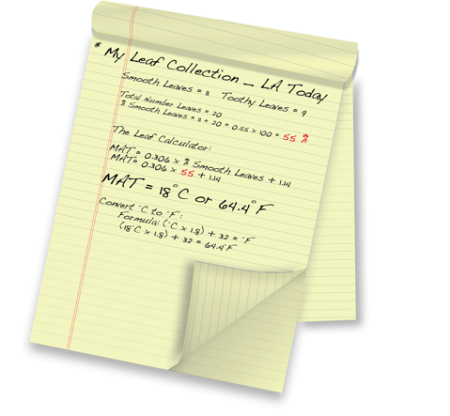
4. Determine the percentage of Smooth Leaves in your collection.
5. Plug in your % of smooth leaves value into the Leaf Thermometer to determine MAT of L.A. today.
6. Convert Celsius to Fahrenheit values using online search or this formula: (°C x 1.8) + 32 = °F
Part 2: What is the Mean Annual Temperature of Ice Age La Brea Tar Pits?
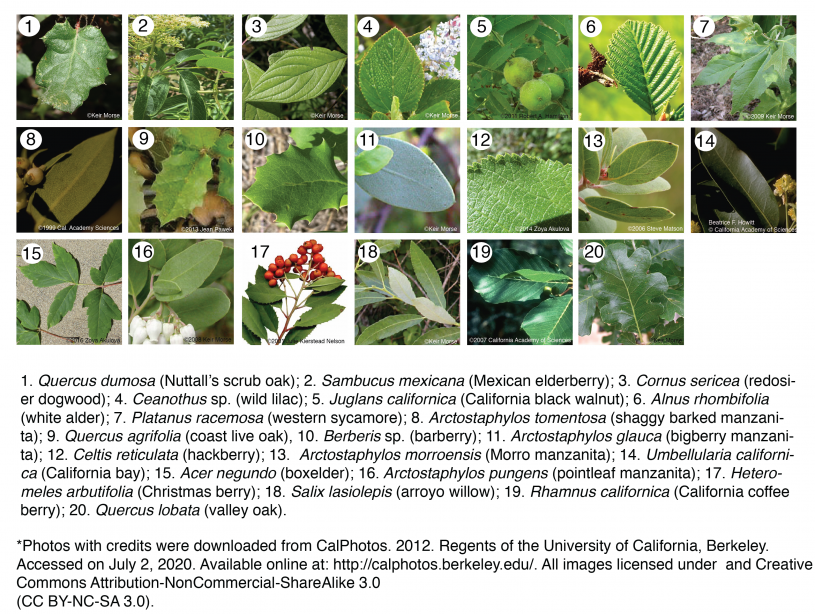
Our final task now is to use the Leaf Thermometer to determine the mean annual temperature for Ice Age times in Los Angeles based on the plant species shown below.
In addition to thousands of vertebrate fossils, the La Brea Tar Pits also preserve a diversity of plant fossils including leaves, wood, fruits and seeds. Paleobotanists have identified which species of plants these fossils belong to, and they have been able to make a list of the plants that lived at the Tar Pits during the Ice Age. Almost all of them are still living today and here are some examples.
To measure the mean annual temperature of Ice Age La Brea Tar Pits, follow these steps:
1. Count the number of Smooth Leaves and Toothy Leaves in the image.
2. Calculate the percentage of Smooth Leaves.
3. Plug the % of Smooth Leaves into the Leaf Calculator.
4. Convert Celsius to Fahrenheit values using online search or this formula: (°C x 1.8) + 32 = °F
See Activity Answer Key for any guidance.
Share Your Data with our Scientists!
Enter the results of your experiments by clicking the button below and calculate the difference between the temperature of modern day Los Angeles and Ice Age Los Angeles ~40,000 years ago in degrees Fahrenheit (°F).
Background Information
Early in the 20th century, scientists recognized that leaves of trees can be used to predict the mean annual temperature (MAT –the average daily temperature for a whole year) of a given location. Consider that there are two kinds of leaves, those that have smooth edges like this one on the left, and those that have toothy edges, like the one on the right. This difference in leaf form is in part a physiological adaptation to temperature. Leaves that have smooth edges tend to grow in warm climates, while those that are toothy tend to grow in cooler environments.

Paleobotanists recognized that this observation could be used to calculate temperature from fossil plants to understand how warm a given place was long in the past, before the time of thermometers.
To do this, they traveled to living forests all over the world and collected leaves from tree species growing in particular areas and they determined the percentage of leaves that had smooth edges in each collection. Next, they obtained climate data for each of these locations from nearby weather stations and plotted the two variables together. Here is a simplified version.
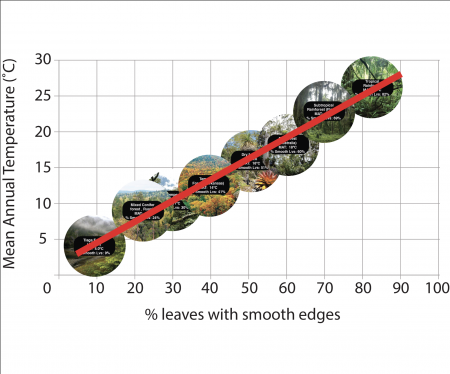
Using this graph and the mathematical formula that defines the relationship between the variables, we can predict the mean annual temperature for a location by determining the % of leaves with smooth edges in a collection of leaves. We call the mathematical formula the Leaf Thermometer.